BKG

Space Weather

Situation Report, June 03, 2025

Overall Situation
4 /5
Severe
ⓘ Explanation of the WESIS Space Weather Scales at the end of the document
Classifications
Geomagnetic Disturbance start: June 01, 06:00 UTC
duration: 9.0 hours
G4
Severe
Disturbance Storm start: June 02, 04:00 UTC
duration: 45.0 hours
D3
Strong
Solar Radio Flux start: May 31, 08:16 UTC
duration: 2 minutes
F2
Moderate
Proton Flux start: May 31, 17:10 UTC
duration: 27.4 hours
S2
Moderate
X-Ray Flux start: May 30, 23:56 UTC
duration: 80 minutes
R2
Moderate
Warnings

Energy Supply

Space Operations

Communication

Navigation

Flight Crew
Solar wind forecast
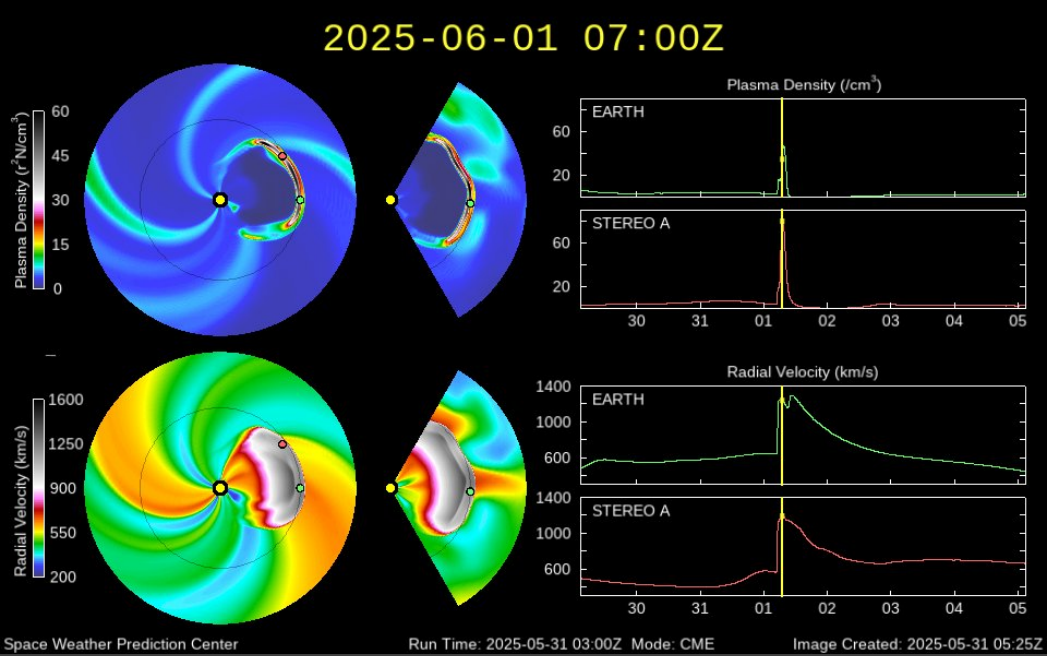
Solar wind forecast generated by the WSA-ENLIL model at the NOAA Space Weather Prediction Center. The images illustrate variations in the density and speed of the solar wind. Significant variations are caused by coronal mass ejections.
Operational Comments
June 01, 2025: A severe geomagnetic storm is currently underway, with a KP index of 8! Solar wind speeds are exceeding 1,000 km/s! The situation could continue into tomorrow.
June 03, 2025: The following day, level G3 was briefly reached again.
June 03, 2025: On June 3, the G3 threshold was reached once again.

Examples of Effects

  • Energy supply: Widespread problems with the control of high-voltage grids are possible; certain protection systems may incorrectly disconnect key components from the grid; induced currents in pipelines are possible.
  • Space operations: Electrostatic charging of satellite surfaces is likely; corrective measures for satellite orientation will be necessary. Single-event upsets may occur sporadically in satellites; this can cause memory modules to fail, for example.
  • Communication: HF radio communication may now only be possible sporadically; LF radio connections have been interrupted. Interference with HF radio communications is possible in areas near the pole. Occasional HF radio blackouts on the sunlit side of the Earth.
  • Navigation systems: Satellite navigation systems can be disrupted for hours. In rare cases, false echoes may occur in radar systems used for airspace surveillance. Navigation in the polar ice cap region may be impaired. Low-frequency navigation signals in maritime and aviation use disrupted up to 15 minutes.
  • Flight crew: Increased risk of cosmic radiation for passengers and crew members on polar routes.
Planetary K-index
Each vertical line represents the Kp index for the corresponding 3-hour interval. The x-axis represents time in the format Day.Month HH:MM UTC. The y-axis shows the index value. Warning thresholds from the NOAA Space Weather Prediction Center (SWPC) are plotted as needed.
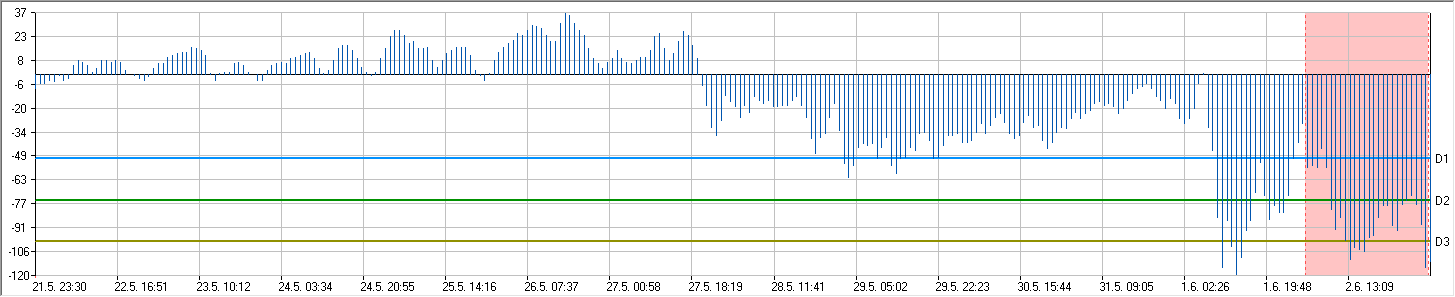
Disturbace Storm Index Dst
Similar to the Kp index, the Dst characterizes geomagnetic activity. However, here the equatorial ring current is calculated using four geomagnetic observatories distributed at regular intervals. The x-axis represents time in the format Day.Month HH:MM UTC. The y-axis displays the DST index value in [nT]. Warning thresholds defined internally by GOW are plotted as needed.
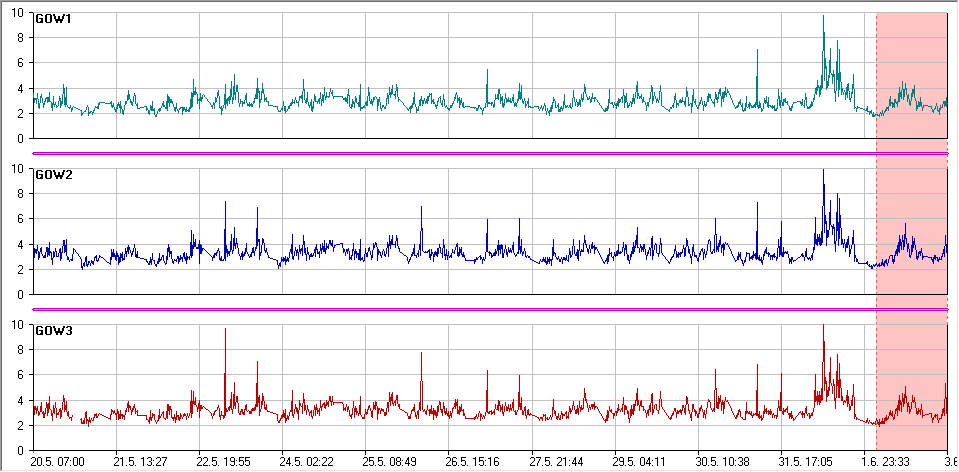
Sigma TEC Rate
Derived from precise phase measurements of the Galileo satellites; indicates the change in electron content over a 15-minute interval. High STR values indicate geomagnetic disturbances; the graph will also show ionospheric scintillations, though these are rare above the GOW. The x-axis represents time in the format Day.Month HH:MM UTC. The y-axis shows the STR variation value in [mm/min].
GOES magnetometer measurements
The geostationary satellites of the U.S. National Weather Service are equipped with vector magnetometers. The x-axis represents time in the format Day.Month HH:MM UTC. The y-axis shows the northward component of the measured magnetic field, Hp, in [nT].
WESIS Space Weather Scales

The warning scale is based on the scale used by the National Oceanic and Atmospheric Administration (NOAA, USA) and comprises five levels, ranging from 1 (mild) to 5 (extreme). Statistically, extreme events occur one to four times per solar cycle. A cycle lasts 11 to 13 years.

D | Disturbance Storm Time (Dst) Index

The Dst Index is a primary gauge for geomagnetic storm severity, derived from a worldwide network of near-equatorial magnetometer stations. It calculates the globally averaged disturbance in the horizontal (H) component of Earth's magnetic field. As solar storms inject energetic ions into the magnetospheric ring current, they create a magnetic field that directly opposes Earth’s field, pushing Dst values deeply negative.

D1 < -50 nT
D2 < -75 nT
D3 < -100 nT
D4 < -200 nT
D5 < -400 nT
E | Electron Flux

The NOAA SWPC tracks the outer radiation belt using geostationary GOES satellites to issue Electron Flux Alerts. Warnings are activated when the >=2 MeV electron flux exceeds 1,000 pfu for three consecutive 5-minute intervals. This indicator warns operators of deep-dielectric charging, where accumulated internal electrical charges in spacecraft components can cause sudden arcing, leading to phantom commands or permanent satellite damage.

E1 1.000 electrons/ second
E2 10.000 e/s
E3 100.000 e/s
E4 1.000.000 e/s
E5 10.000.000 e/s
F | Solar Radio Flux

A parameter to which we actively contribute using the Solar Flux Telescope (CLT). Similar to the case of X-rays (see R-scale), the amounts of energy emitted during solar flares are reflected in the measurements of solar energy flux as so-called radio bursts. If the measurements increase abruptly, they are converted to the warning scale according to the following scheme: Increase in solar flux greater than:

F1 500 sfu
F2 1.000 sfu
F3 10.000 sfu
F4 20.000 sfu
F5 40.000 sfu
G | Geomagnetic Storms

The NOAA SWPC uses the G-Scale to categorize the severity of Geomagnetic Storms caused by solar wind variations. The scale directly maps to the planetary Kp-index, ranging from G1 (Kp = 5) up to G5 (Kp = 9). It serves as a vital operational warning system for power grid operators regarding transformer damage, pipeline engineers tracking corrosive currents, and satellite flight dynamics teams monitoring increased atmospheric drag and surface charging.

G1 Kp5
G2 Kp6
G3 Kp7
G4 Kp8
G5 Kp9
I | Electron Content

Total Electron Content (TEC) is the integrated electron density along a signal path through Earth's ionosphere, measured in TEC Units (TECU). Rapid increases in TEC, driven by solar EUV/X-ray flares and geomagnetic storms, directly modify the refractive index of the upper atmosphere. This causes signal phase delays and range errors for Global Navigation Satellite Systems (GNSS/GPS), high-frequency (HF) radio degradation, and satellite-to-ground communication disruptions, making it a critical metric for precision aviation and maritime navigation. We determine the total electron content using our own GNSS measurements.

I1 40 TECU
I2 50 TECU
I3 60 TECU
I4 70 TECU
I5 85 TECU
R | X-Ray Flux

The NOAA SWPC uses the R-Scale to categorize Radio Blackouts caused by sudden solar flare X-ray emissions. The primary metric is the peak X-ray flux measured in by GOES satellites, mapping directly to flare classes from R1 (M1 class) up to R5 (X20 class). It warns maritime, aviation, and military operators of sudden ionospheric absorptions that block HF radio communication and cause positioning errors in low-frequency navigation systems.

R1 0.00001 W/m² (M1 Flare)
R2 0.00005 W/m² (M5 Flare)
R3 0.0001 W/m² (X1 Flare)
R4 0.001 W/m² (X10 Flare)
R5 0.002 W/m² (X20 Flare)
S | Proton Flux

The NOAA Space Weather Prediction Center (SWPC) uses the S-Scale to categorize Solar Radiation Storms. The primary metric is the elevated proton flux (>=10 MeV), measured in Particle Flux Units (pfu) by GOES satellites. Stoms range from S1 (>=10 pfu) to S5 (>=100,000 pfu). It warns industries of polar HF radio communication failures, spacecraft orientation errors, and heightened radiation hazards.

S1 10 protons/second
S2 100 p/s
S3 1.000 p/s
S4 10.000 p/s
S5 100.000 p/s